Week 31:
A week of positive feelings
Giorgia
Feeling good!
This week I noticed and reported every positive feelings and thoughts I happened to have during my days: anything from goodwill, to happiness and joy, to positive anticipation, to gratefulness, to love...
Stefanie and I agreed that this would have been a good investigation moment for ourselves, and the experiment turned out to be worthwhile for both of us!
In fact, as we move forward on Dear Data, we are realizing that when our weekly topic is somehow positive, we tend to be happier throughout the whole week; while when we track anything that is related to negativity, we live our days in a general worse mood.
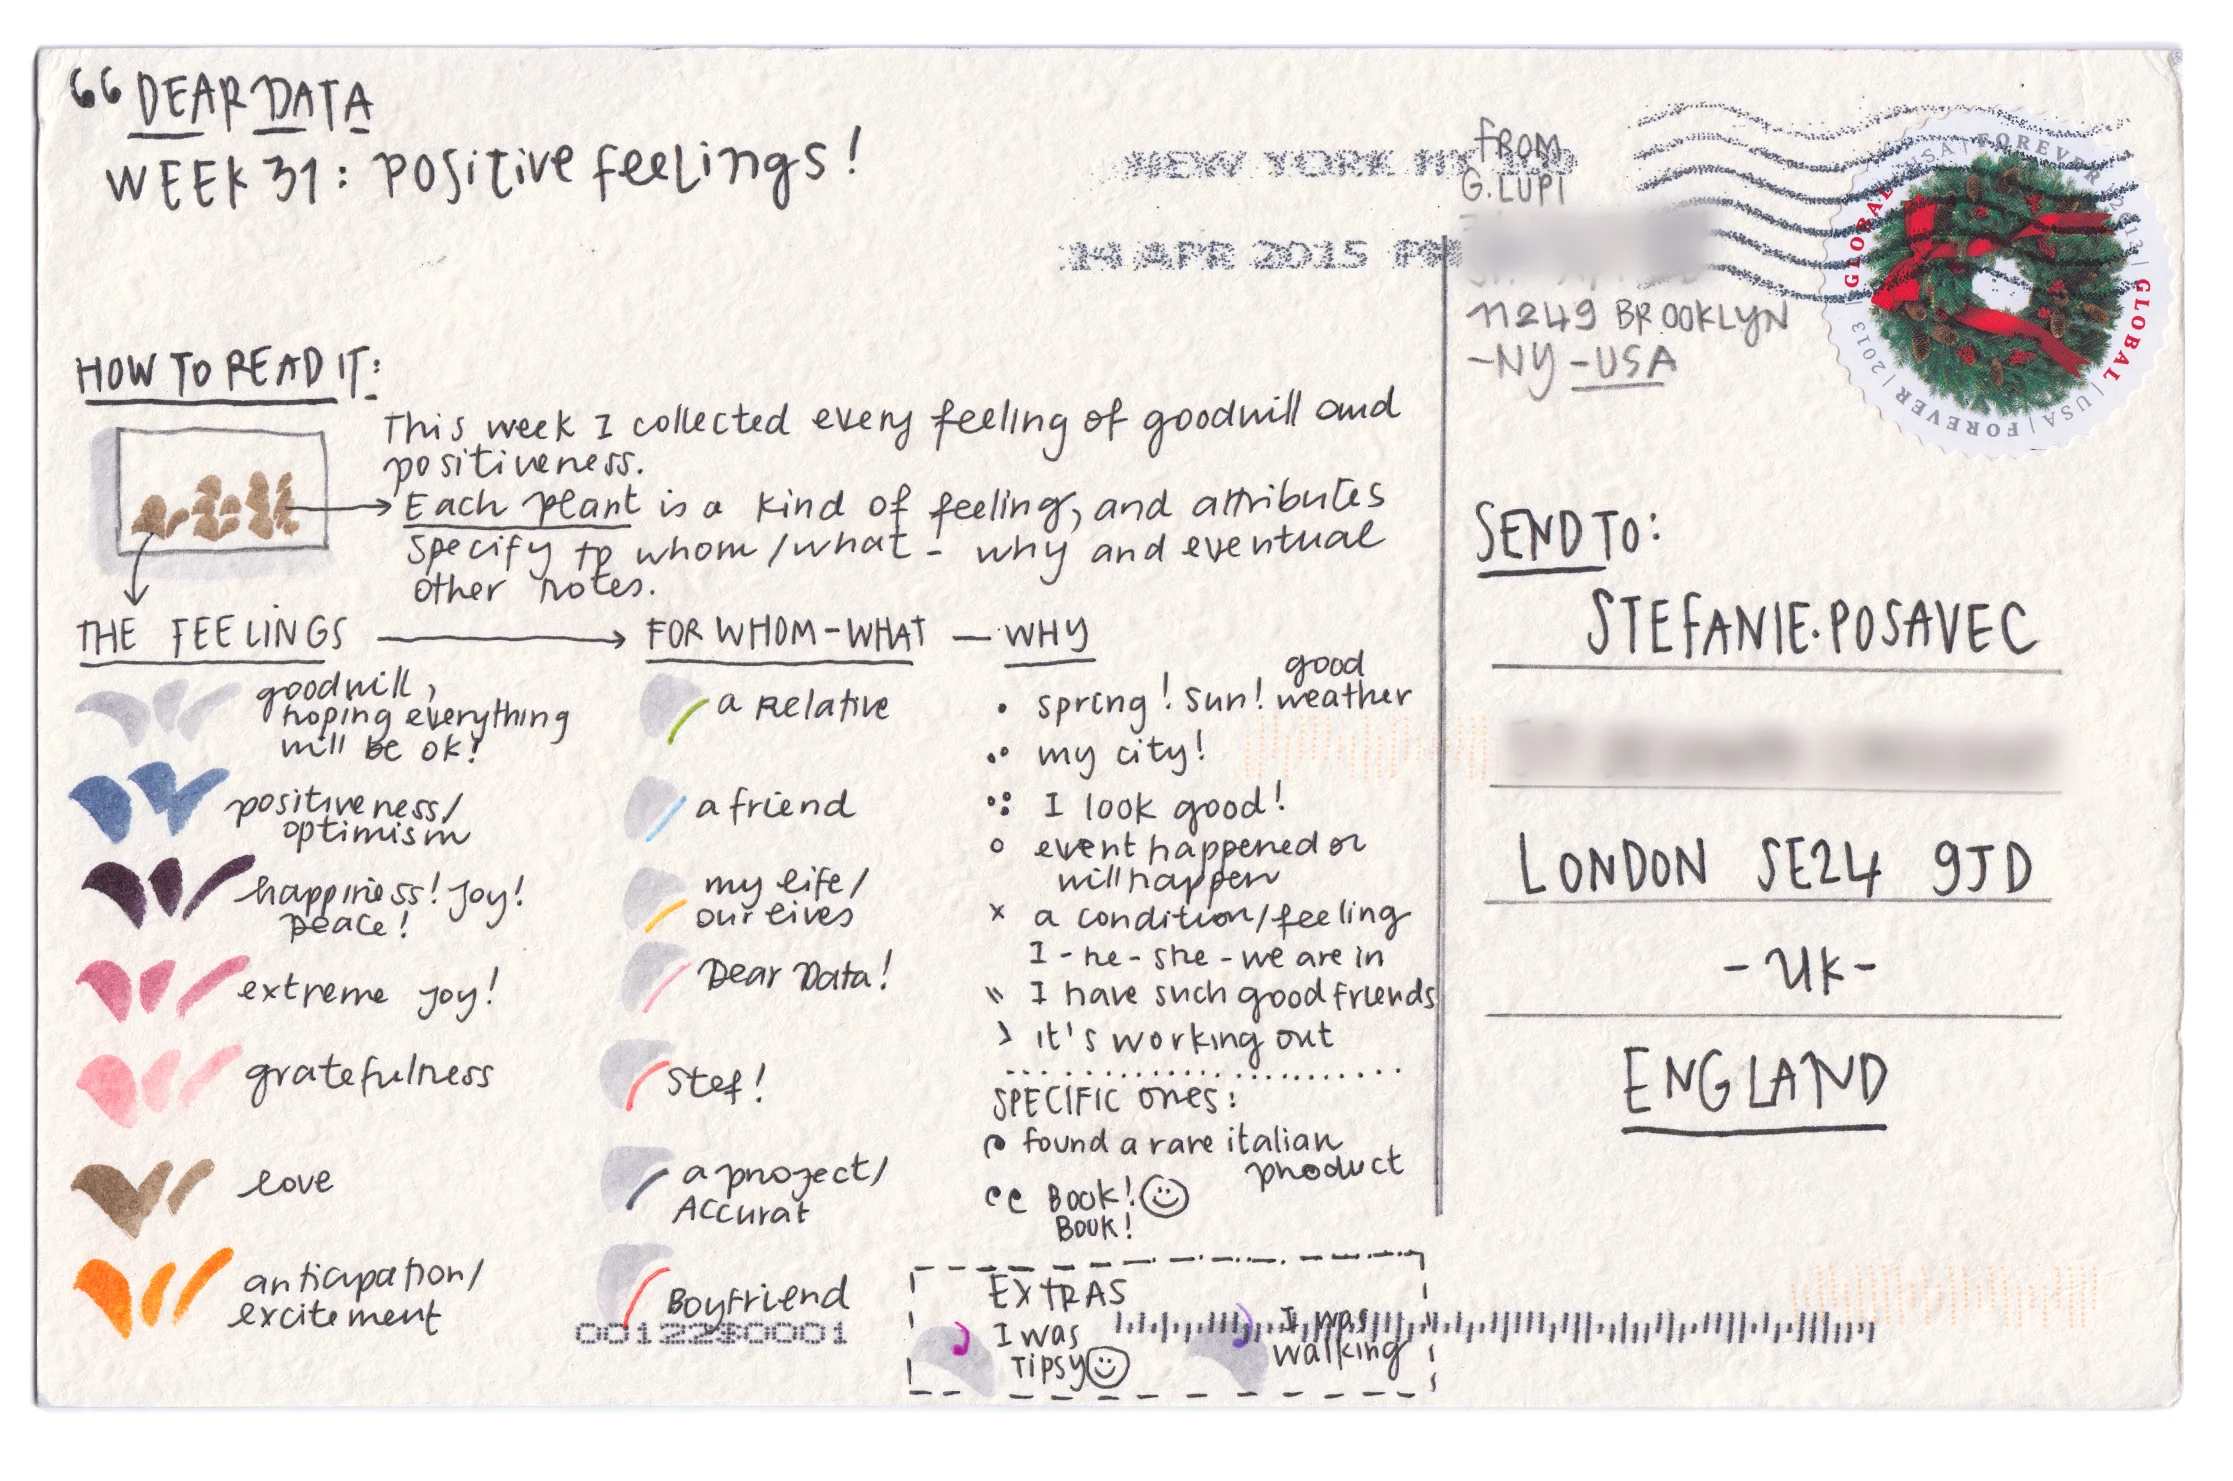
During the week, I reported the kind of feelings or thoughts I was having, the main motivation or topic around the sensation, and noted down lots of extra details I organized only later.
The data drawings
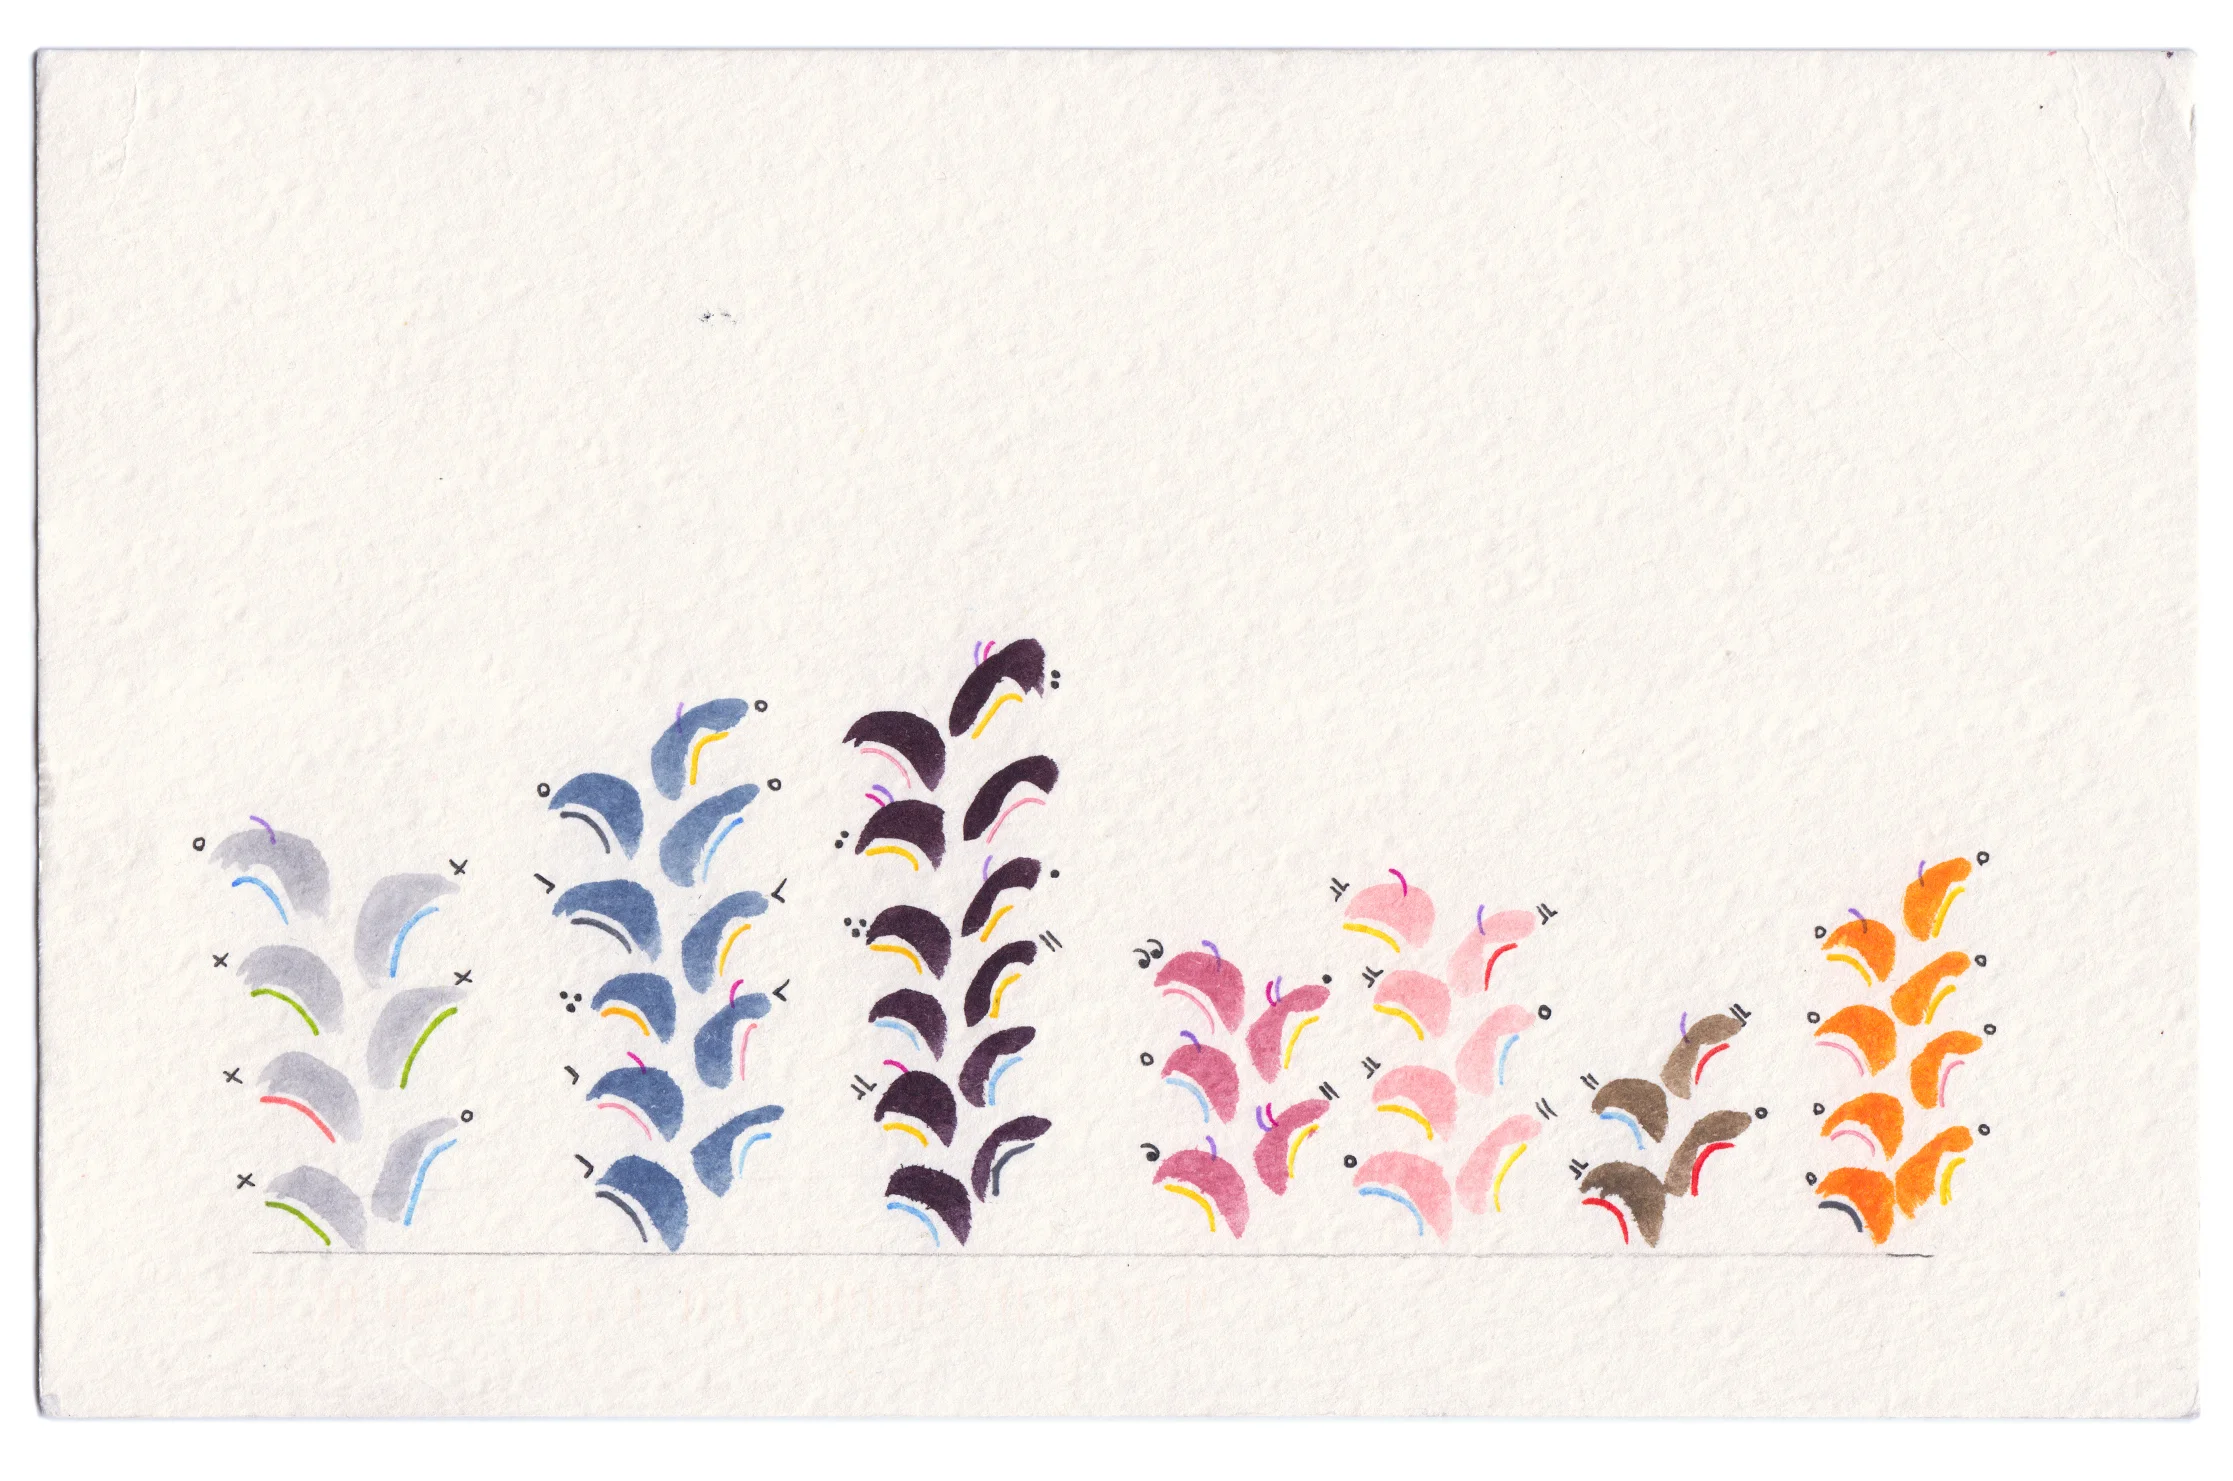
In my drawing, I wanted to convey an idea of “growth”, in a way, so I illustrated my data as if they were springing up from the bottom of the postcard and to the top.
By looking at the drawing one can tell that the most prevalent sensation was a general feeling of happiness and serenity for my life: moments of contemplation and gratefulness for the city I live in and for the kind of life I am living.
I also experienced several sparks of true joy for something nice that happened to my friends, family and to my boyfriend; and various bits of enthusiasm for work-related events.
I thought it was important to put my positive feelings into context, so I also recorded where I was and what I was doing at the moment: I was very often walking (yes, walking generally makes me feel positive!), and I entered lots of logs during the evenings, while winding down the day with my boyfriend and friends after work.
And - data friendship! I love that both Stefanie and I had positive feelings towards each other! As always our drawing reflect our visual styles, I can’t help being still very much fascinated about Stefanie’s ‘radial’ perception, I am still so linear as a visual thinker!
Our surroundings, and little things.
This week I started to wonder whether the overall kind of energy of the city you live in can influence yours. I generally find myself happier since I moved to New York, and especially since I live in Brooklyn.
Of course there are many factors that influence one’s mood and general well-being, but I know that as a person I am very much affected by the dynamics I sense around me.
This week, as soon as I realized that a lot of my positive entries were about my city, I started to pay more attention to the ambiance around me as I walked through my days, and to how little details might impact my mood: the busyness, the lush of a nearby park, the smells, the buildings, and the general vibrancy of the different people I walk past or I am surrounded by.
Also, happiness to me has always been related to a sense of accomplishment: the ability to set goals for myself, achieving those goals, living in an atmosphere of overall growth and learning; and I know this is the foundation I need in order to function as a human being.
But I probably don’t acknowledge enough how it is important to find little things in our everyday life that can make us happier: sometimes also small facts can get a smile out of you. One of the most joyful record of my week, for example, is about me finding two rare Italian beauty products my mum and grandmother use in a little shop here in Brooklyn:…a little expats joy that definitely made a good part of my day!
Finally, the optimistic mood of this week of data naturally flooded into my following week: I definitely found myself stopping for a moment every now and then and actually letting the positive thoughts and the gratitude ones break in the stress - grumpiness, and mental to do lists that I was going through even after week 31!
Yes, Dear Data reminds me more and more how the ability to be self aware and present is something you can exercise and learn!
The Process:
Stefanie
The optimism that you feel in the springtime where you are certain that this summer is going to be the BEST SUMMER EVER was the inspiration for Giorgia and I to spend this week tracking the positive emotions we felt as we walked through a week of springtime.
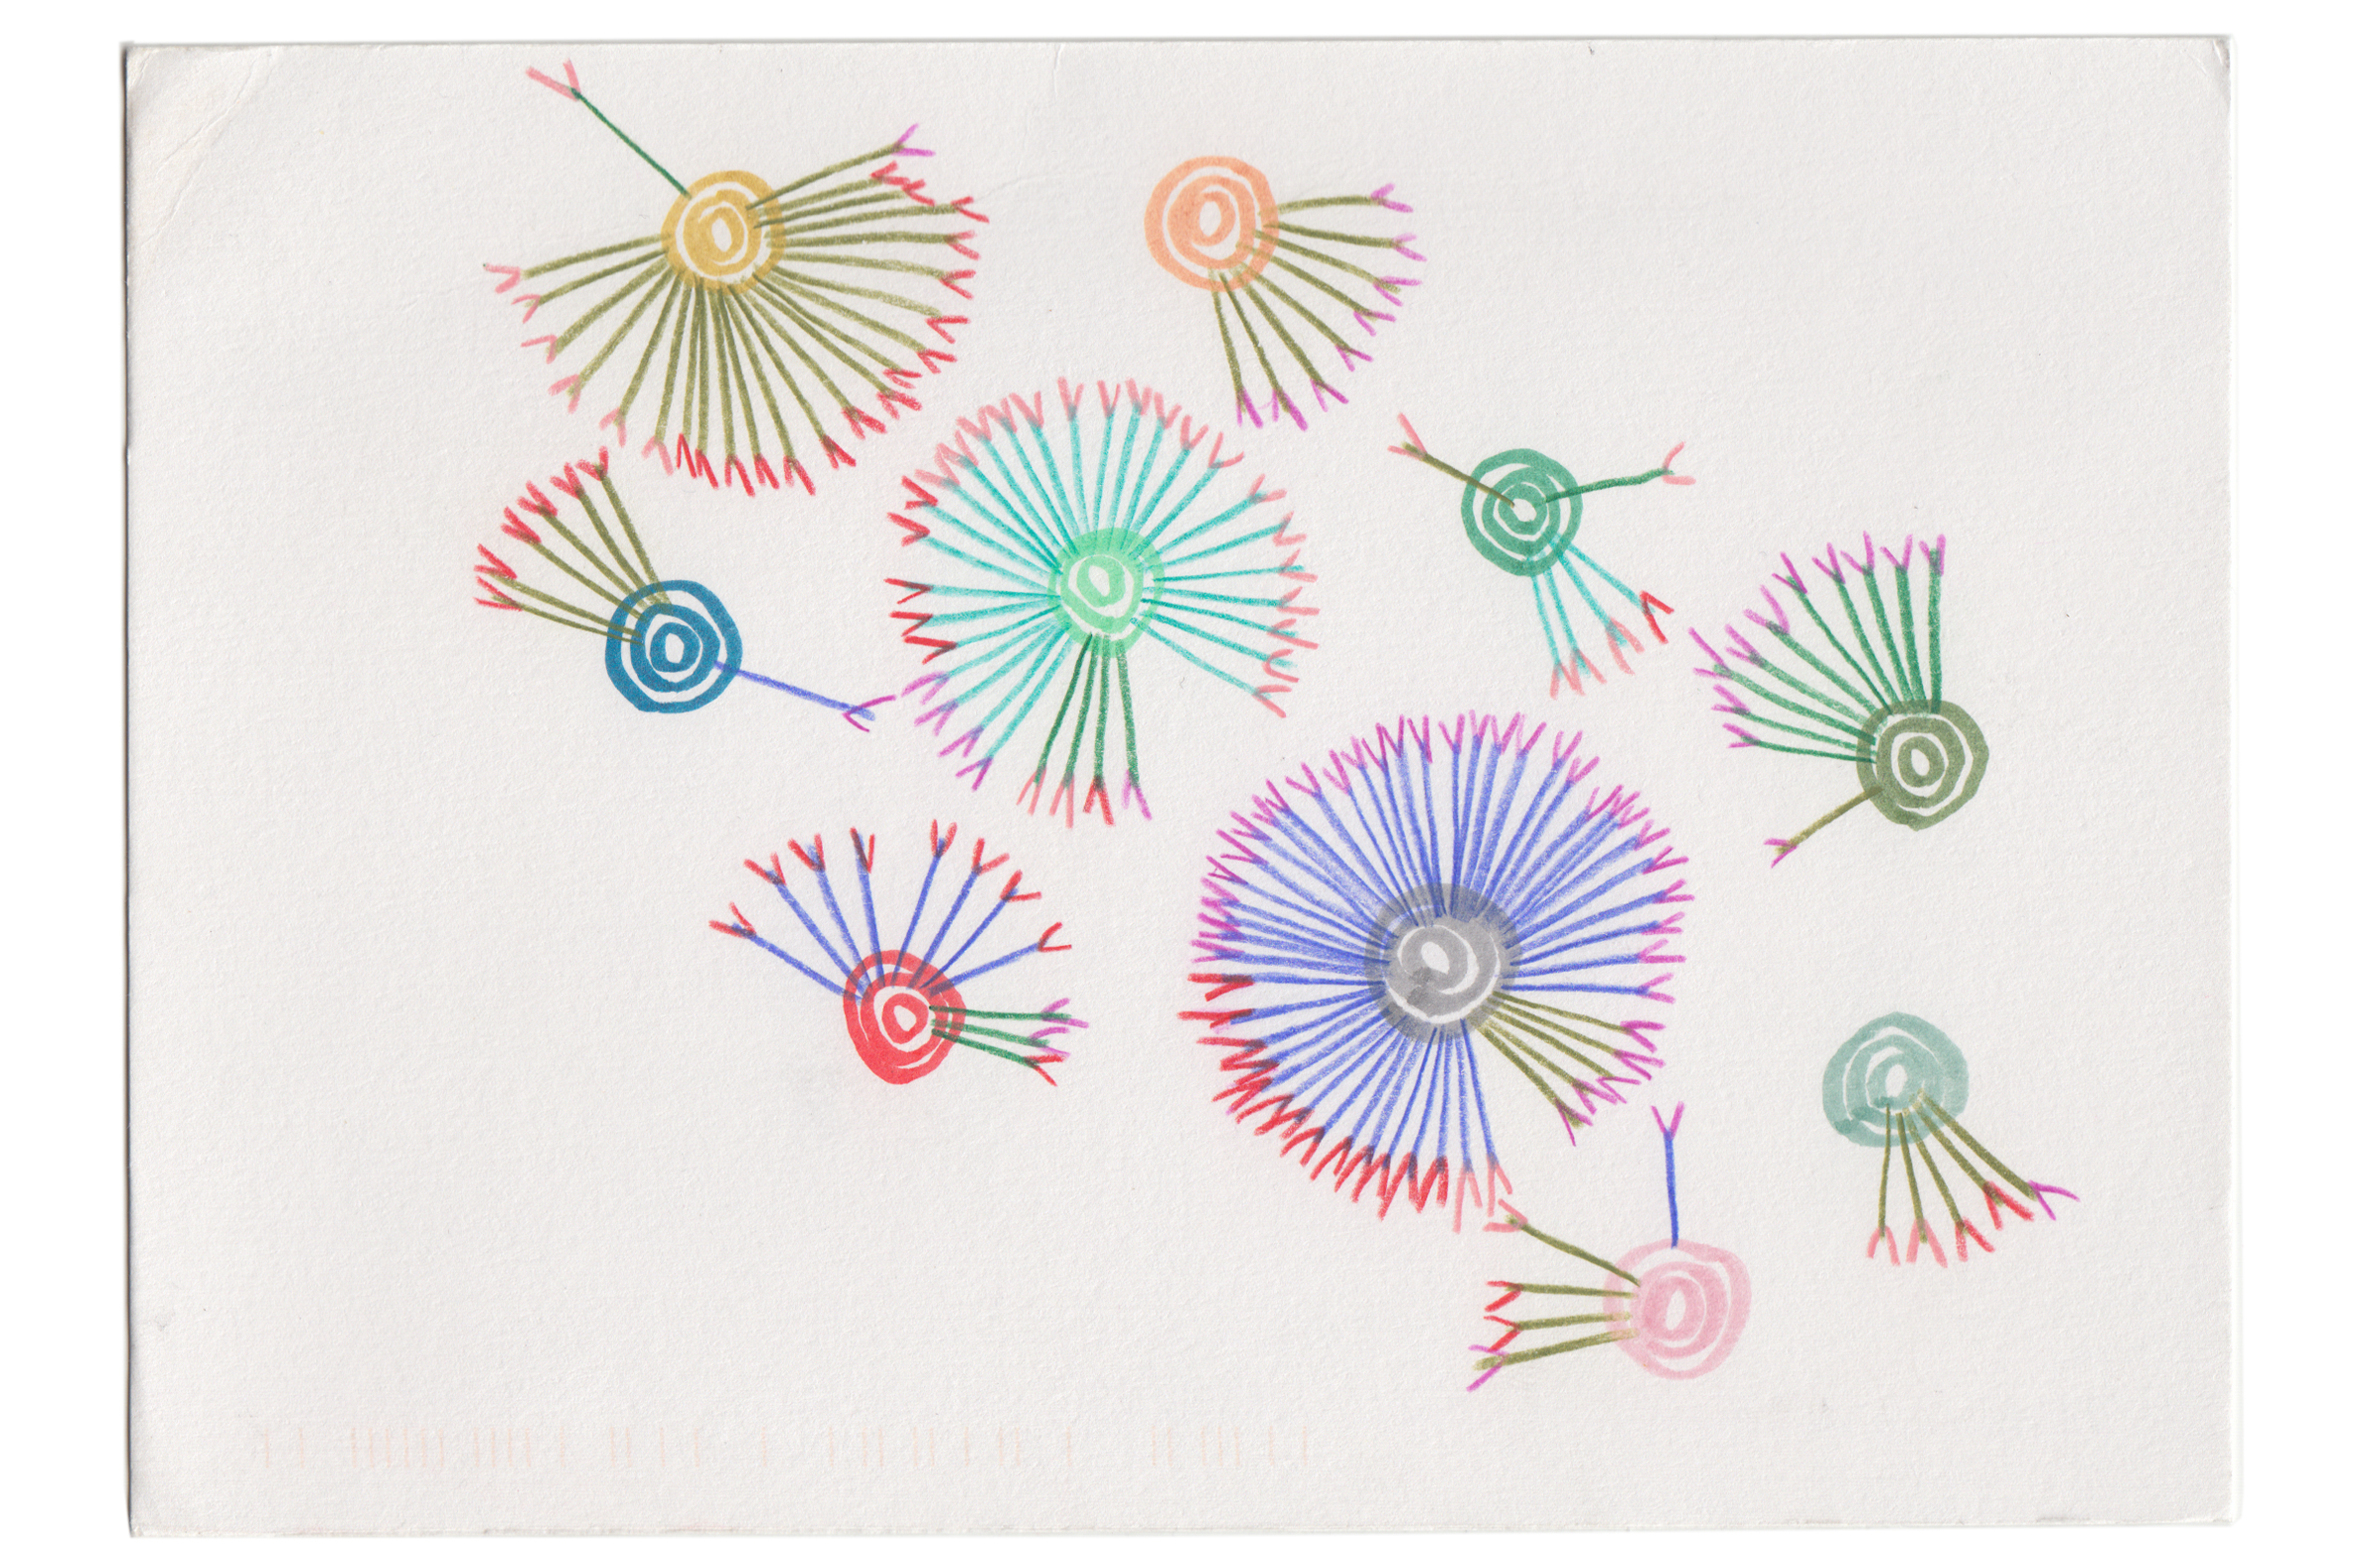
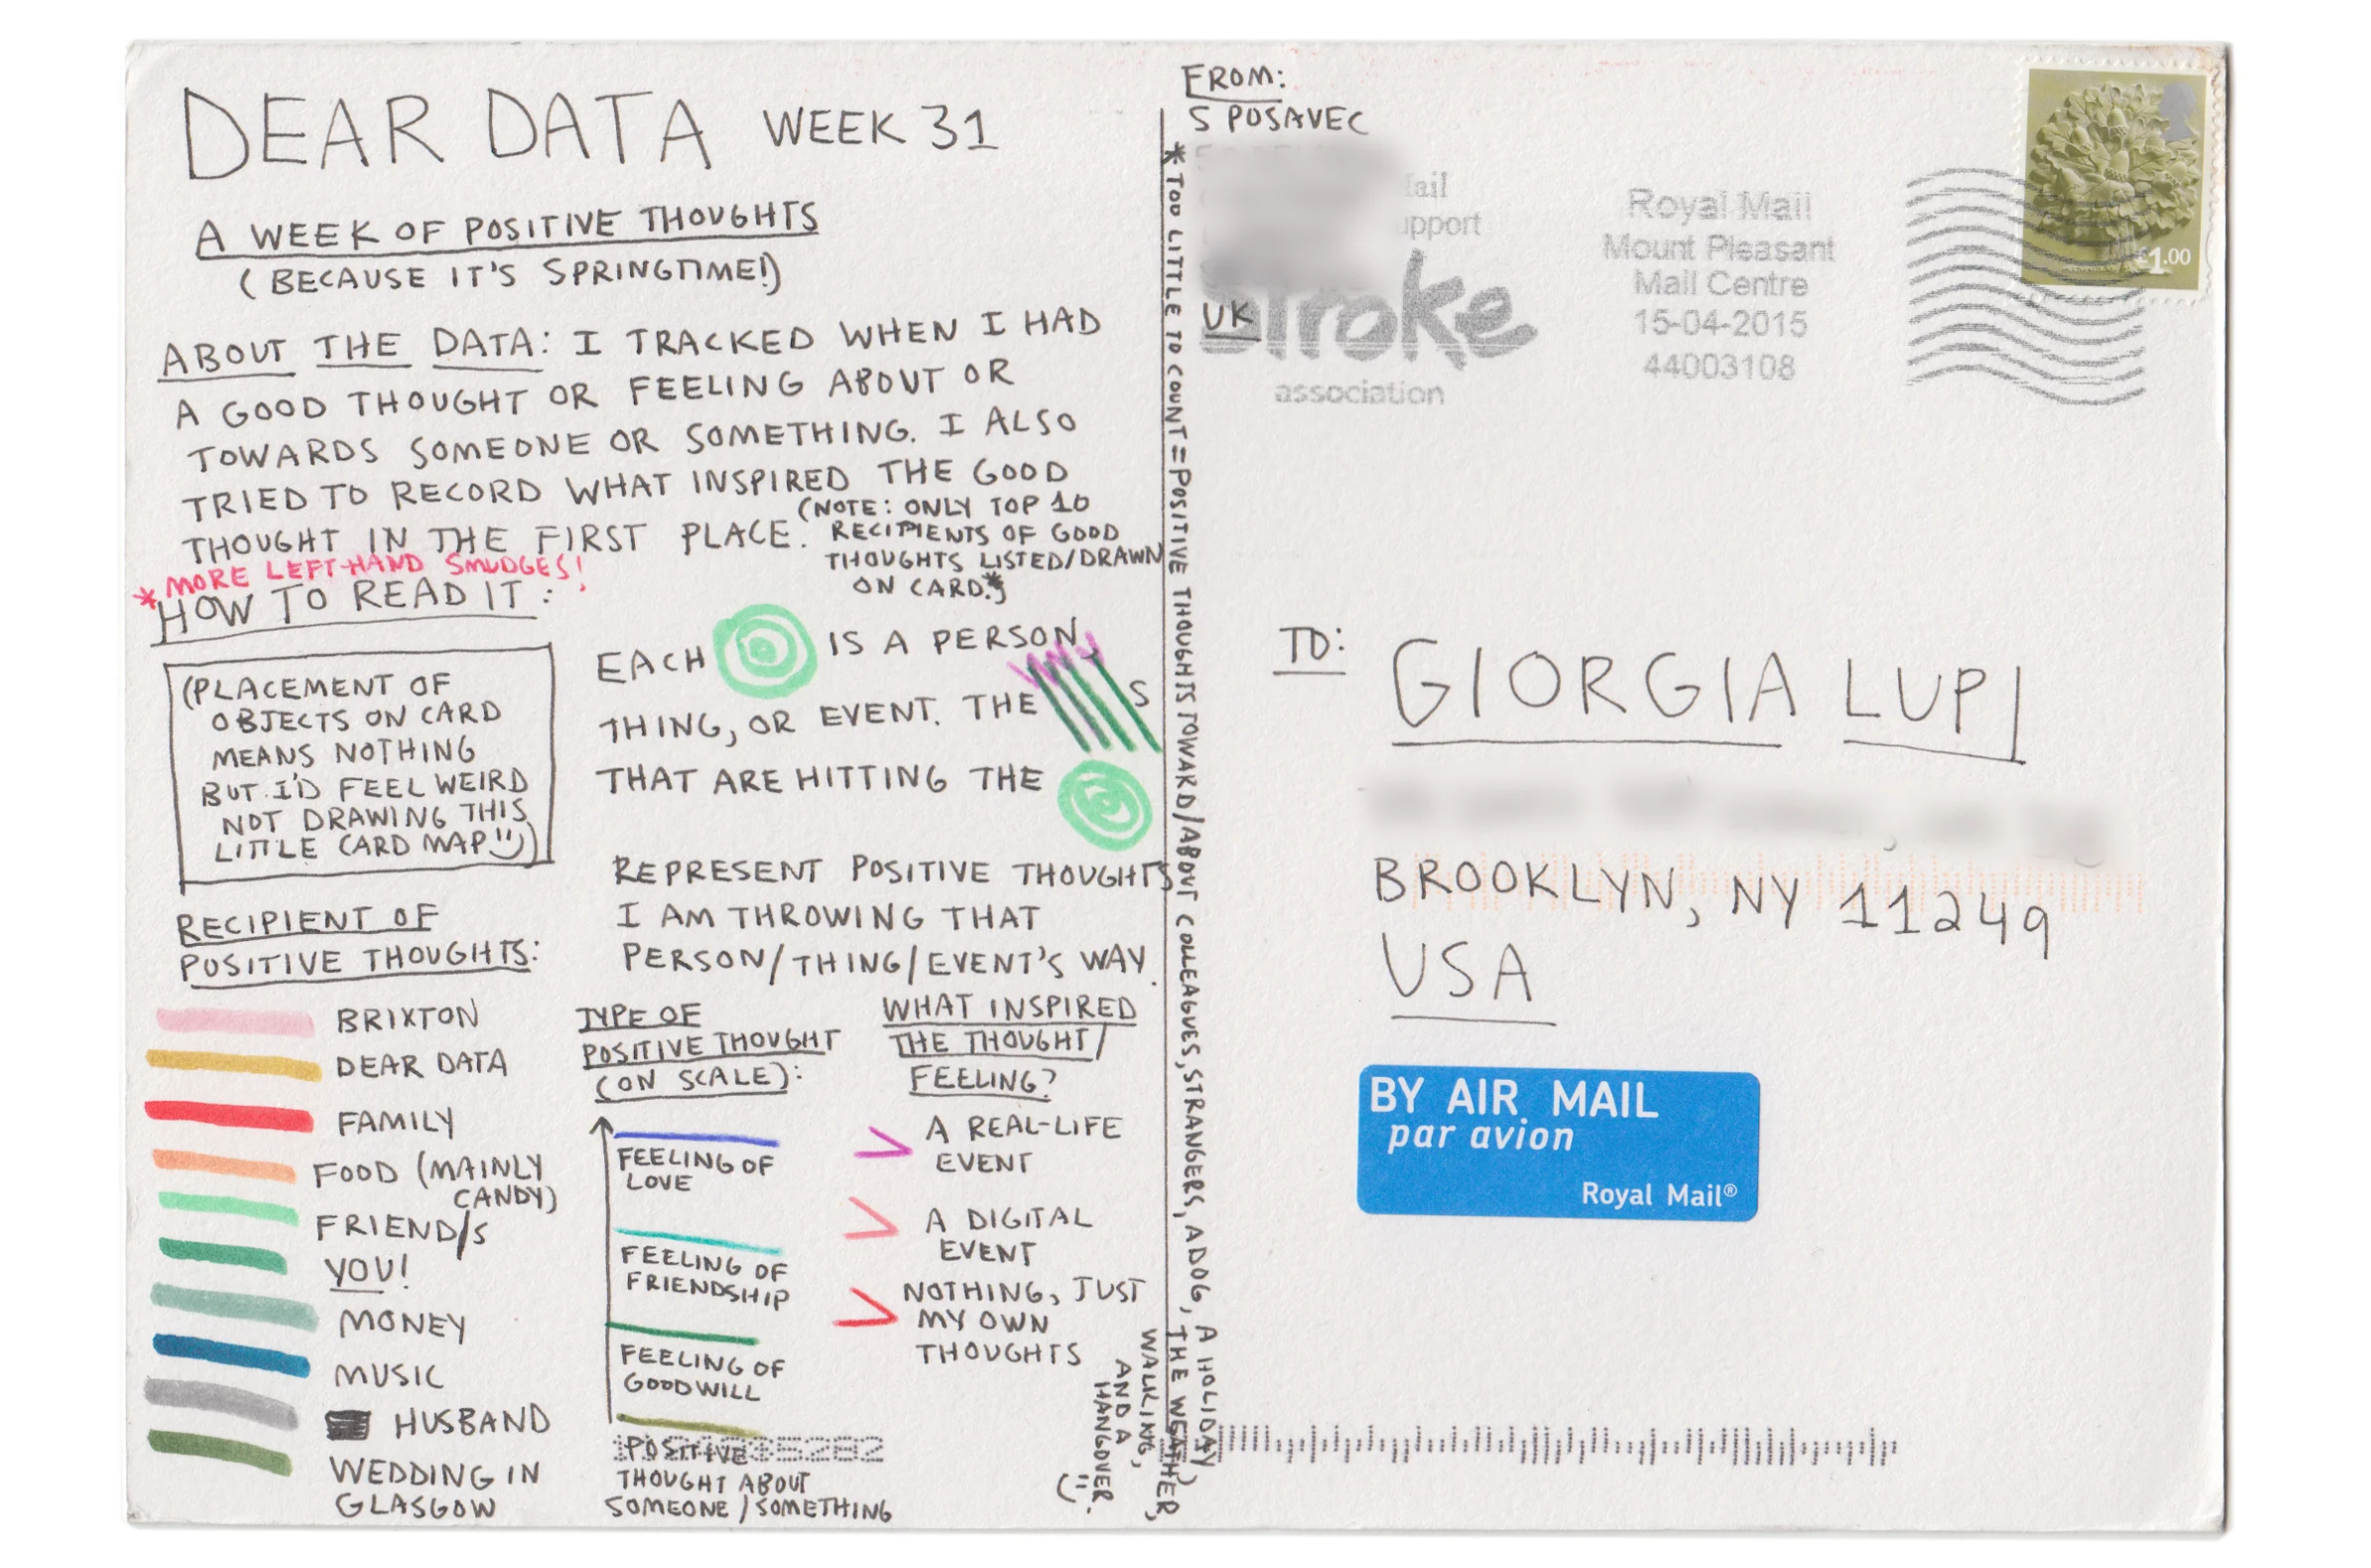
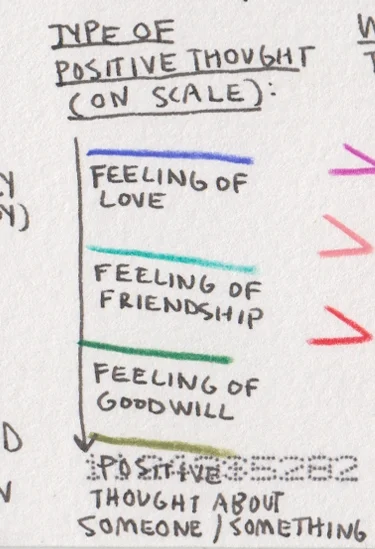
I was able to determine four separate types of positive feeling I would have toward others, places, and objects, and placed them on a scale from the most intense feeling to the least intense feeling of goodwill.
These included feelings of:
Love: the strongest feeling, mainly reserved for my partner, very close friends, my family
Friendship: for friends (of course)
Goodwill: When I wish someone well and want them to be happy, even if I don’t know them well
Positive Thought: the least-strong feeling, just a good feeling about someone/something
Of course, these different categories might not necessarily be neat steps upon a scale of positive thoughts, but what I’ve learned through the course of this project more than anything is that each week often becomes a physical representation of my mental way of categorising the world, however messy and illogical that categorisation might be.
I gathered data on feelings inspired by people I know to strangers passing by on the street, or even inanimate objects such as ice cream (because it’s the best thing ever), and was lucky enough to attend a wedding this week and track the feelings of goodwill I felt for the bride and groom. Of course, I didn’t do this openly during the ceremony, but through memory, adding positive feelings to a list that I kept repeating in my mind.
Focusing on these feelings brought them to the fore and made them feel sharp and tangible.. it felt as though the edges of positive feelings are quite defined in my mind, and easy to take notice of.
My drawing alludes to arrows and targets, referencing how when you
think a positive thought about someone or something, it feels as though you are sending it invisibly through the atmosphere to land lightly on your chosen recipient.
Our cards have become a dataset… are we allowed to
make changes?
The week aside, we’ve had our first post-posting error realisation, and of course it was mine.
When I sent this card to Giorgia, she asked me some questions about my positive feeling categorisation scale that seemed unusual, but I didn’t think much of it. However, through the course of writing this piece and looking more closely at the card that I sent, I realised that I had made a mistake when drawing the legend of this card: I carelessly drew the scale the wrong way, so feelings of love was the least important positive feeling… oops. This completely misrepresents these how these feelings meant to me over the course of this week, and because of my emotional attachment to this dataset of love and goodwill, seeing this mistake pains me.
This feels like an error that needs to be rectified before showing to a
wider audience.
This poses a problem: while publishing the card here, do I leave as-is, so everyone can see the card as Giorgia has seen it, even though there is a mistake? Do I retouch the postcard scan, tell Giorgia, and then not tell anyone publicly? Or do I need to re-draw and re-send the card completely from scratch, so there is a completely accurate card in the collection?
These questions feel quite important, as our cards have become a dataset now, albeit one crafted of paper and pen. In my professional life, I would rectify my mistake immediately in the pursuit of accuracy. However, by changing this card I feel I’m manipulating both the spontaneous ‘data’ that was drawn during this week in the spring as well as misrepresenting what Giorgia saw and experienced upon receiving this card in her mailbox. It doesn’t feel right to digitally-retouch a scan of a postcard while the rest of the process has been so handmade.
However, I have a solution that feels in keeping with the ‘slow data’ spirit of the project: I will retouch this postcard scan now, for ease of understanding, but will rectify the change on the actual postcard through correcting it and re-posting the same card to Giorgia, thus modifying our analogue dataset in a way that is keeping with our entire format.
To uphold transparency, here is the aforementioned change, before
and after:
Maybe this is being too paranoid about accuracy, but it's something I'll discuss with Giorgia, and if you’re reading this, I would love to know what you think. But after spending so much time crafting a format that is grounded so completely in the physical world, digital retouching feels like a manipulation of my and Giorgia’s shared experience.
The Process:
And look at that dappled springtime sunshine!

